
Semiquantitative photochromic dosimetry of UV-C exposure in classrooms, dental clinics and restrooms: an exploratory experimental study
Dosimetría fotocrómica semicuantitativa de la exposición UV-C en aulas, clínicas odontológicas y baños: estudio experimental exploratorio
Universidad Católica Redemptoris Mater, Managua, Nicaragua · ROR
Original published · English translation
English translation of the Spanish original, prepared by the journal with AI assistance and checked for text, numbers, tables and references. Disclosures and manuscript-approval statements translated below concern the original study. Figures retain their original labels; captions and tables are translated.
Abstract
Objective. To characterize UV-C dosimetric readings across indoor surfaces and compare them with nominal targets and calculated exposure.
Methods. An exploratory experimental study with descriptive analysis was conducted in 2022 in classrooms, dental clinics and restrooms in Managua, Nicaragua. Twelve series used single-use UVCiX cards read visually. An HP350UVS electronic source-characterization spreadsheet was incorporated. Electronic irradiance, poster-reported values, calculated doses and visual readings were distinguished.
Results. Fourteen numerical readings from eight series supported the dosimetric description; ten allowed comparison with nominal targets. In G1, poster-reported irradiances yielded 97.2 mJ/cm² at both positions; cards indicated 90–100 mJ/cm² at 1 m for 15 min and 50–75 mJ/cm² at 2 m for 30 min. Another classroom yielded 35, 10–15 and 10–15 mJ/cm² after 30 min. Dental readings included 40 mJ/cm² after 10 min and 75 and 150 mJ/cm² after 37 min. Reading-to-target ratios ranged from 10.0 to 125.0%. The spreadsheet placed 0.021 mW/cm² at 2.5 m, whereas dental posters placed it at 1 m.
Conclusions. Indicator responses varied across positions and conditions, including conditions with equal calculated exposures. The study provides a surface-specific dosimetric comparison that distinguishes electronic measurement, calculation and visual reading. Its semiquantitative scope characterizes physical exposure and does not evaluate microbiological efficacy.
Key points
Question. How do UVC exposure readings vary across positions and conditions compared with nominal targets and irradiance–time calculations?
Findings. Eight of the twelve series supplied fourteen numerical readings. Ten readings were compared with nominal targets; ratios ranged from 10.0–125.0%. Two calculated exposures of 97.2 mJ/cm² were accompanied by different visual ranges.
Meaning. Interpretation retains position and distinguishes electronic measurements, calculated exposures and semiquantitative visual readings.
Plain-language summary
The study examined 2022 practical exercises in classrooms, dental clinics and bathrooms at a university. The cards showed different responses depending on position and exposure conditions. Comparison with the exercises' targets and with irradiance–time calculations documented local differences relevant to interpreting an exposure. Visual readings are semiquantitative and refer to each position assessed. The work characterises physical exposure; microorganism elimination and infections were not measured outcomes.
Introduction
The UVC exposure received by a surface depends on local irradiance and exposure time. Within a room, position relative to the source, orientation and intervening objects produce different irradiation conditions. Boyce and colleagues observed variation in irradiance and dose across locations in hospital rooms assessed using a mobile device [1]. Equipment operating time alone therefore provides an incomplete description of surface exposure.
Photochromic indicators record colour changes associated with accumulated exposure. Neu and colleagues evaluated photochromic indicators through radiometric comparison and highlighted the importance of protecting them from light sources unrelated to the exposure of interest [2]. Su and colleagues demonstrated that colour quantification, accompanied by calibration and uncertainty characterisation, can turn certain indicators into quantitative dosimeters [3]. Those results apply to specific indicators and procedures; visual comparison with a printed scale is a semiquantitative approach.
Card interpretation distinguished visually estimated exposure, the nominal target and exposure calculated from irradiance and time. This distinction is particularly relevant in furnished environments with surfaces of different orientations. This study aimed to characterise variation in dosimetric readings of UVC exposure on indoor surfaces and compare them with nominal targets and calculated exposures under the conditions assessed.
Methods
Design and setting
An exploratory experimental study of environmental dosimetry, with descriptive analysis, was conducted at Universidad Católica Redemptoris Mater, Managua, Nicaragua, in 2022. Spaces were selected by convenience and included computing, digital art, anatomy, microbiology and histoembryology classrooms, dental clinics and bathrooms. Investigators established source arrangements, indicator positions and exposure durations. Card responses were assessed under the applied conditions.
Records were organised into twelve series, C01–C12. The unit of analysis was a reading linked to a position and condition. The archive included posters, photographs and the Dosis Tesla UV Rays.xlsx spreadsheet characterising the sources electronically. Spreadsheet irradiances and those recorded on each poster were kept separate. Repeated photographs of a card were treated as a single documentary source. Those responsible ratified readings, positions, distances and times, and a specialist reviewed the relationship between the source, electronic measurement and card. Checking distinguished electronic measurements, calculated exposures and card readings.
Radiation sources and environmental arrangement
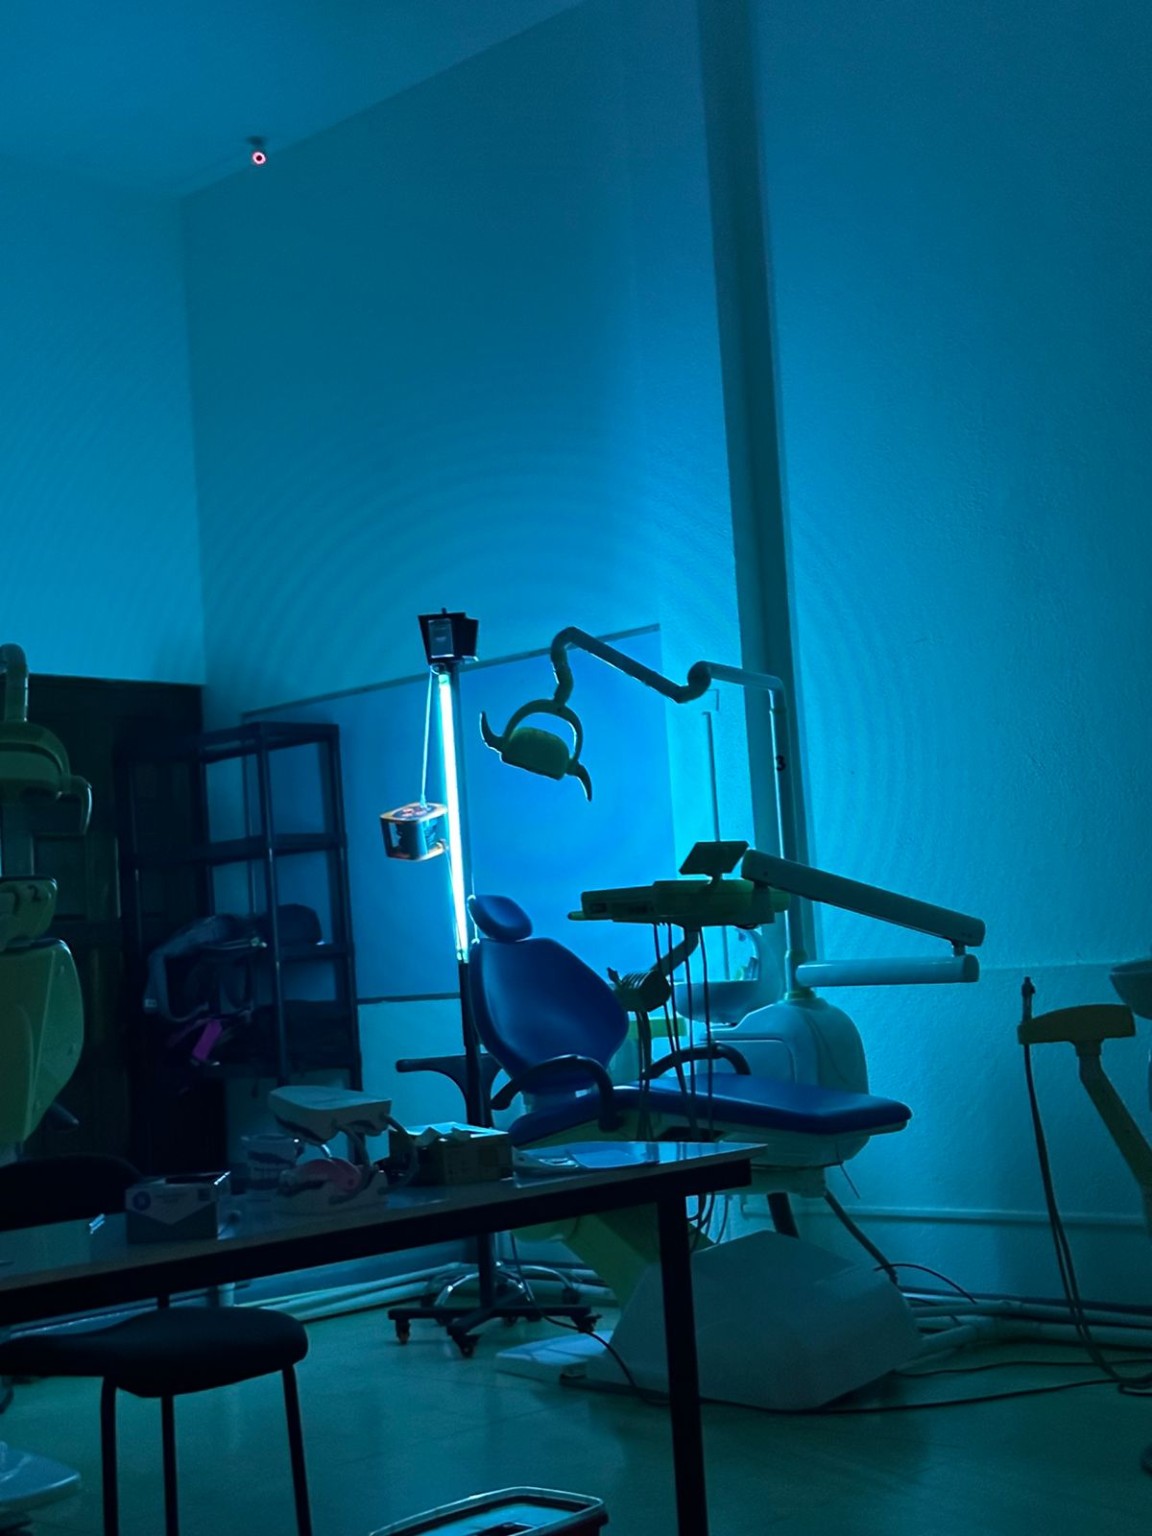
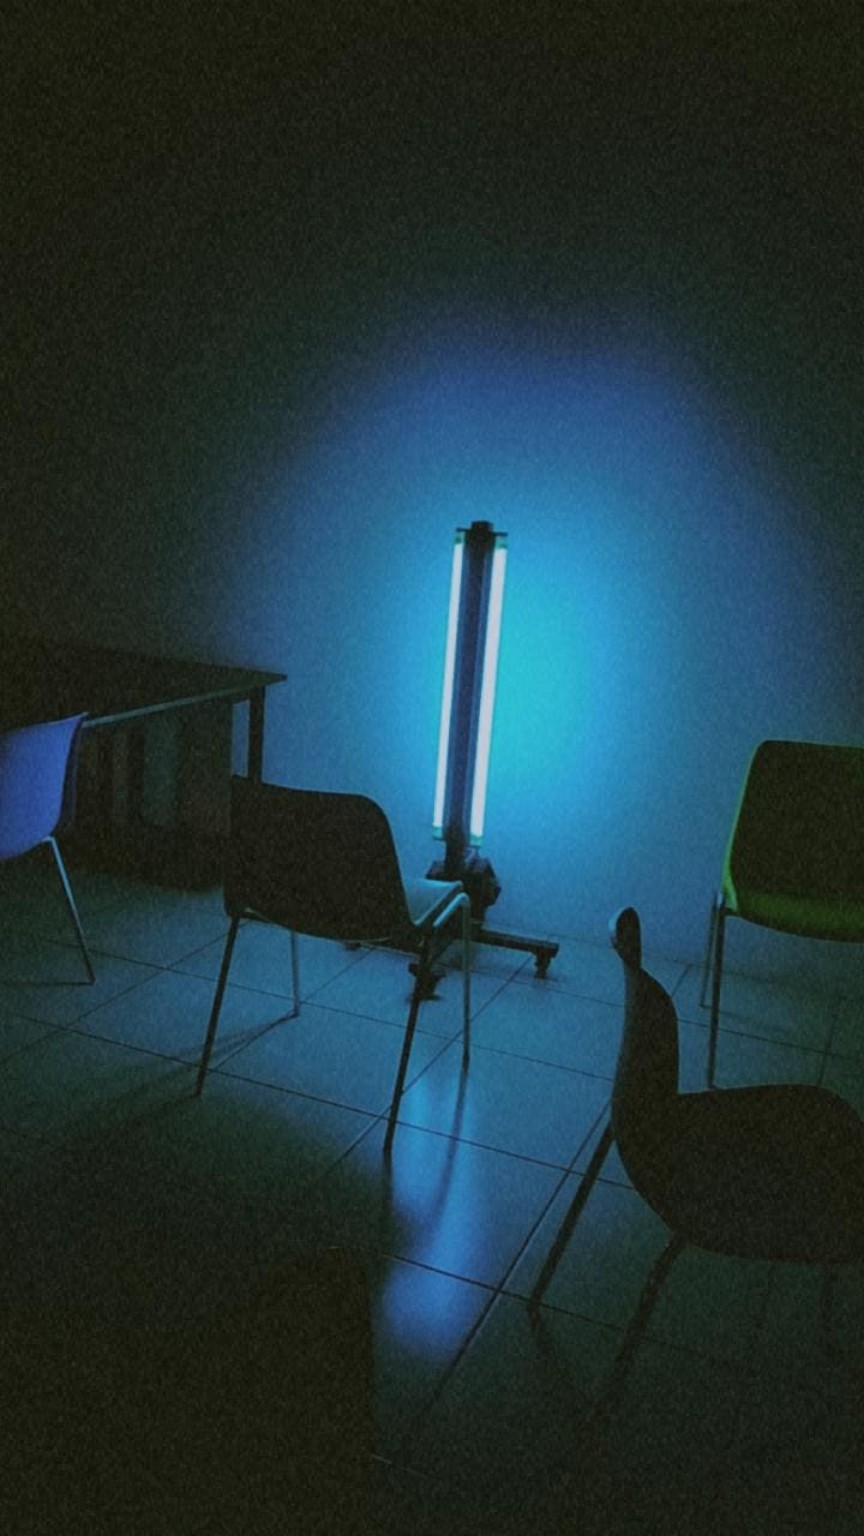
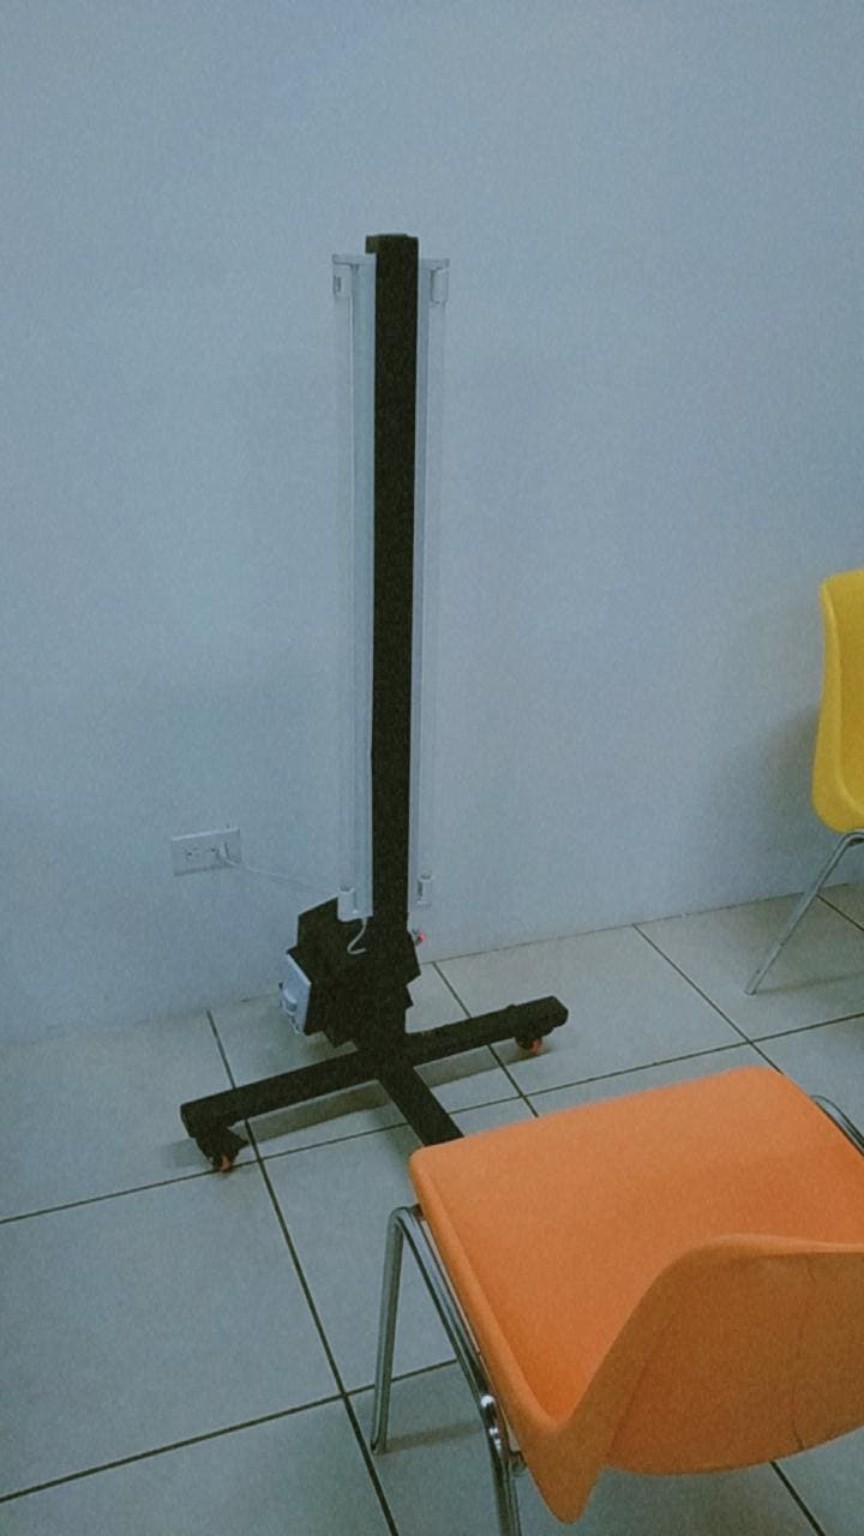
Portable sources and fixed ceiling lamps were used, with a predominant nominal wavelength of 254 nm. Classroom lamps were manufactured by Shenzhen Hongmao Lighting Co., Ltd. (Shenzhen, China). Portable configurations included a 60 W trolley and a 120 W tower. In dentistry, fixed 30 W lamps were arranged linearly on the ceiling, with 10 m between lamps; in histoembryology, fixed lamps were 10 W and 3 m apart. Powers are nominal, and spacings describe the installation, not the distance from the source to each indicator. C07, C08 and C10 used the portable trolley; C09 used the fixed dental installation. Recorded source–indicator distances ranged from 1–5 m. Table 1 summarises conditions, and Figure 1 illustrates configurations from the environmental archive.
Photochromic indicators and dosimetric variables
UVCiX photochromic cards with references of 25, 50, 75, 100, 200 and 300 mJ/cm² were used. Each card was single-use; prolonged exposure was analysed as an accumulated reading. Pigmentation was compared visually with the scale, retaining semiquantitative values and ranges. Values of 10–15 mJ/cm² were treated as estimates below the first printed reference. Lighting during reading varied and was distinguished from ambient lighting during exposure. Switching room lights off was not interpreted as switching the UVC source off or as guaranteeing complete darkness. Absence of pigmentation was classified as a qualitative response.
Dose was expressed in mJ/cm². Hvis was defined as the visual reading, Hobj as the nominal target, Hcalc as calculated exposure and Eeq as equivalent mean irradiance. Electronic characterisation used an HP350UVS UV spectroradiometer, with a nominal 200–450 nm range, and was recorded in the spreadsheet. Accumulated exposure was subsequently checked using cards. Electronic irradiance was distinguished from irradiance recorded on each poster. Hcalc was calculated from associated irradiance and duration; Eeq was calculated from visual dose and effective time:
Hcalc = Eref × t Eeq = Hvis / t tcalc = H / Eref R = 100 × Hvis / Hobj
Eref and Eeq are expressed in mW/cm²; t and tcalc in seconds; and R as a percentage. Minutes were multiplied by 60. Hcalc assumes constant irradiance; tcalc is a calculated time and does not replace an observed duration. Eeq is a quotient derived from the card, not an independent electronic measurement. Distance was retained as a geometric datum associated with each record, without inferring it from dose or time. Hobj is a planning criterion, not a microbiological efficacy threshold validated by this study.
Record analysis
Analysis was descriptive by position. Readings with an identifiable dosimetric unit were included, and irradiances were normalised: 1 mW/cm² = 1000 µW/cm² = 10 W/m². Spreadsheet target times were recalculated using tcalc = H/E. Qualitative responses were retained without a numerical dose. An electronic irradiance was not assigned to a card without correspondence between source, distance and position.
For each reading range, endpoint ratios were calculated. Ranges represent the recorded visual range, not confidence intervals. Ratios were rounded to one decimal place and equivalent irradiances to three significant figures. In C06, the analysed duration was 30 min, corresponding to the results record. In C07, accumulated exposure was 40 mJ/cm² after two 5 min intervals. The two lateral C03 readings were described without linking them to one of the planning times.
Comparisons distinguished surface, distance, duration and source. Observations were not considered interchangeable replicates; individual values and ranges were presented without pooled estimates or significance tests. The radiometric comparison was arithmetic, between Hvis and Hcalc. Microbial reduction was not measured.
Photographic documentation
Images were used to describe the arrangement of sources and furniture. Original proportions and colours were preserved. Numerical readings came from study records; photographs documented the configurations.
Results
Environmental conditions and composition of the analysis
The twelve series comprised exposure configurations in classrooms, dental clinics and bathrooms (Table 1). Fourteen numerical readings were identified across eight series: C02, C03, C04, C06, C07, C08, C09 and C10. Ten readings had a nominal target for calculating R, and ten were linked to an effective duration for calculating Eeq. These counts refer to readings and documentary series, not to a number of independent sessions.
| Series | Setting | Recorded configuration and duration |
|---|---|---|
| C01 | Computing G2 | Portable trolley; 1 m for 2 and 5 min; 3 m for 15 min; room lights off. |
| C02 | Computing G2 | 3 m for 15 min. |
| C03 | Computing G2 | 60 W trolley; planning times of 5, 10 and 25 min; lateral readings without an associated time. |
| C04 | Digital art G1 | Table at 1 m for 15 min; chair back at 2 m for 30 min. |
| C05 | Histoembryology | Fixed 10 W lamps 3 m apart; cards at 2 m; 20 and 60 min sessions. |
| C06 | Microbiology and histoembryology | Three positions for 30 min; no associated metric distances. |
| C07 | Dental clinic 6 | 60 W trolley; one accumulated reading after 5 + 5 min. |
| C08 | Dentistry | 60 W trolley; table and headrest for 37 min; residual afternoon sunlight. |
| C09 | Dentistry | Ceiling: 30 W lamps, 10 m linear spacing; headrest and spittoon; chair criterion at 2 m. |
| C10 | Anatomy | Portable trolley; 3 m for 15 min; condition at 5 m with 25 min specified in the targets. |
| C11 | Anatomy | 1 and 5 m for 25 min; abundant sunlight; 10 s check close to the source. |
| C12 | Bathrooms | Two cards at 1 and 2 m; overall duration 57 min. |
C01 and C12 had responses described as positive. C01 recorded exposures with room lights off. C08 was conducted in the afternoon, at positions with less incoming sunlight, without complete darkness; C11 described a room with abundant sunlight. C05 recorded no initial change after 20 min and slight pigmentation in a second 60 min session, with cards at 2 m. In C11, no pigmentation was observed at 1 and 5 m after 25 min, whereas checking close to the source produced a visible response after 10 s. In C10, the condition at 5 m was described qualitatively as below the expected result; the 25 min referred to the time specified in the targets. C12 comprised two cards at 1 and 2 m and an overall duration of 57 min, without a numerical reading by position.
C02 recorded 30 mJ/cm² at 3 m over 15 min. C03 recorded two lateral readings of 75 mJ/cm² and a front-facing card with no response. Planning doses of 32.4, 64.8 and 162 mJ/cm² for 5, 10 and 25 min are consistent with the 0.108 mW/cm² recorded on the poster. They were not counted as additional readings or automatically identified with a spreadsheet electronic value.
Dosimetric readings and equivalent mean irradiance
| Series and position | Reading (mJ/cm²) | Eeq (mW/cm²) | Target (mJ/cm²) | R (%) |
|---|---|---|---|---|
| C02 · computing 3 m · 15 min | 30 | 0.0333 | 32 | 93.8 |
| C03 · lateral A Distance and time — | 75 | — | — | — |
| C03 · lateral B Distance and time — | 75 | — | — | — |
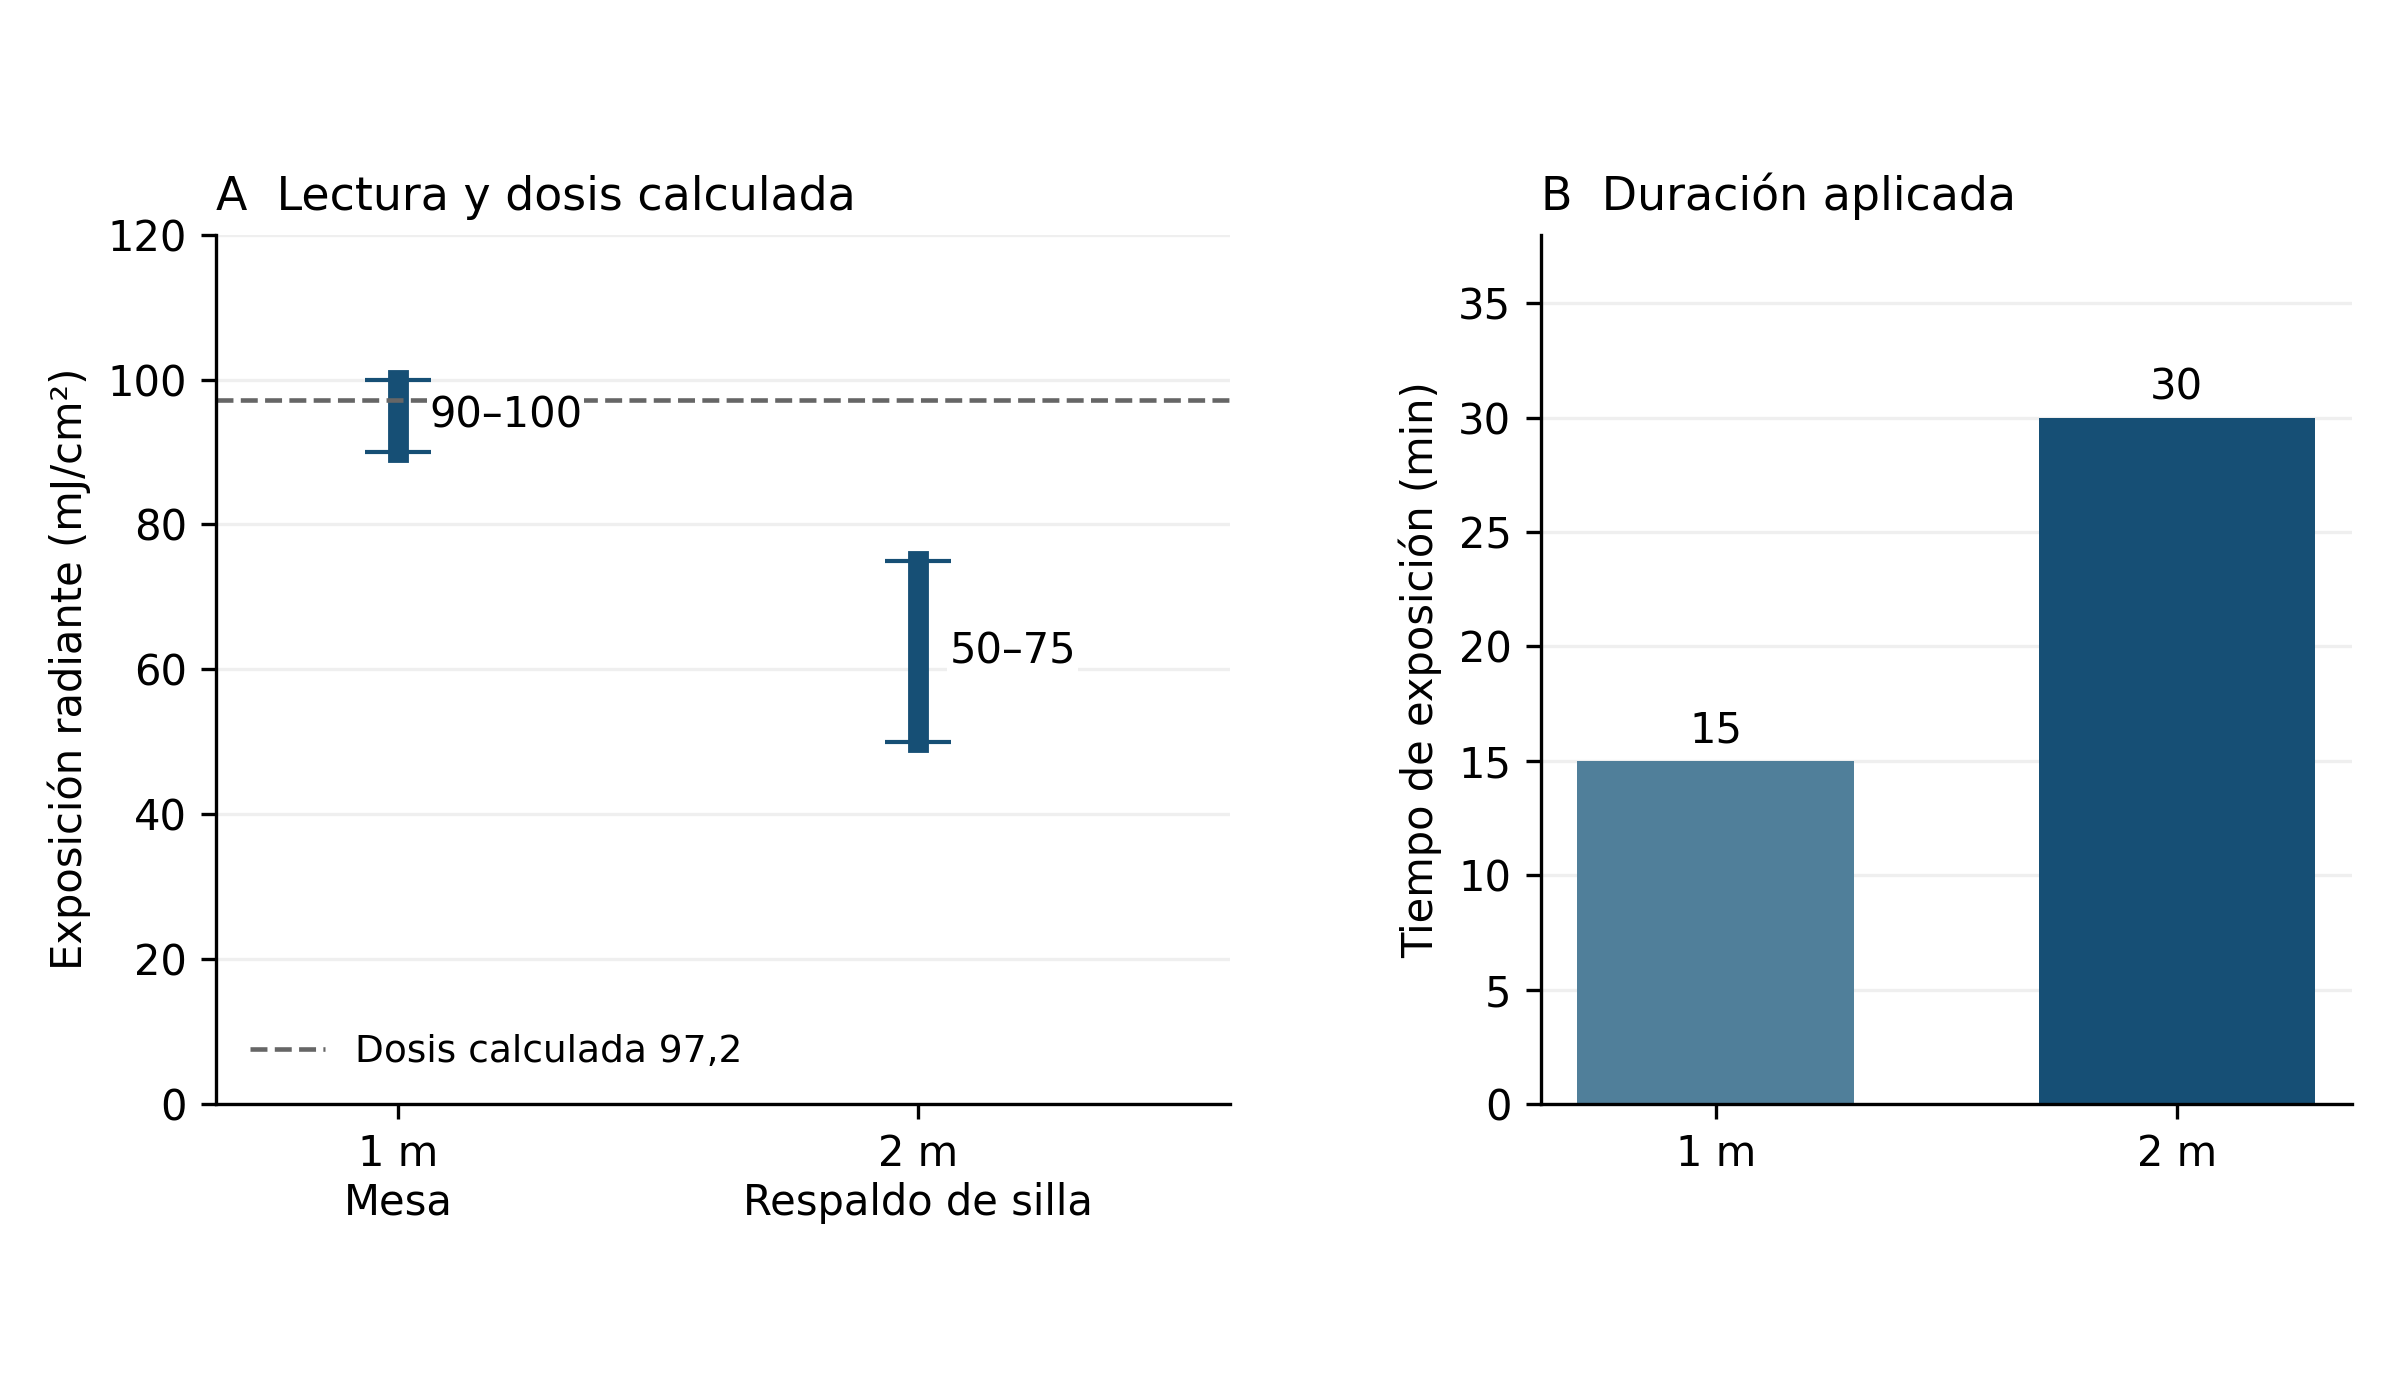
| C04 · table 1 m · 15 min | 90–100 | 0.1–0.111 | 96 | 93.8–104.2 |
| C04 · chair back 2 m · 30 min | 50–75 | 0.0278–0.0417 | 96 | 52.1–78.1 |
| C06 · position A Distance — · 30 min | 35 | 0.0194 | 100 | 35.0 |
| C06 · position B Distance — · 30 min | 10–15 | 0.00556–0.00833 | 100 | 10.0–15.0 |
| C06 · position C Distance — · 30 min | 10–15 | 0.00556–0.00833 | 100 | 10.0–15.0 |
| C07 · dentistry Distance — · 10 min | 40 | 0.0667 | 32 | 125.0 |
| C08 · table Distance — · 37 min | 75 | 0.0338 | — | — |
| C08 · headrest Distance — · 37 min | 150 | 0.0676 | — | — |
| C09 · headrest Distance and time — | 50 | — | 162 | 30.9 |
| C09 · spittoon Distance and time — | 75 | — | 162 | 46.3 |
| C10 · anatomy 3 m · 15 min | 30 | 0.0333 | 32 | 93.8 |
Eeq = reading/time in seconds; R = 100 × reading/target. —: datum not associated or calculation unavailable. A, B and C are C06 positions without an assigned surface. Eeq is a derived calculation. The 10–15 mJ/cm² ranges are below the first printed reference.
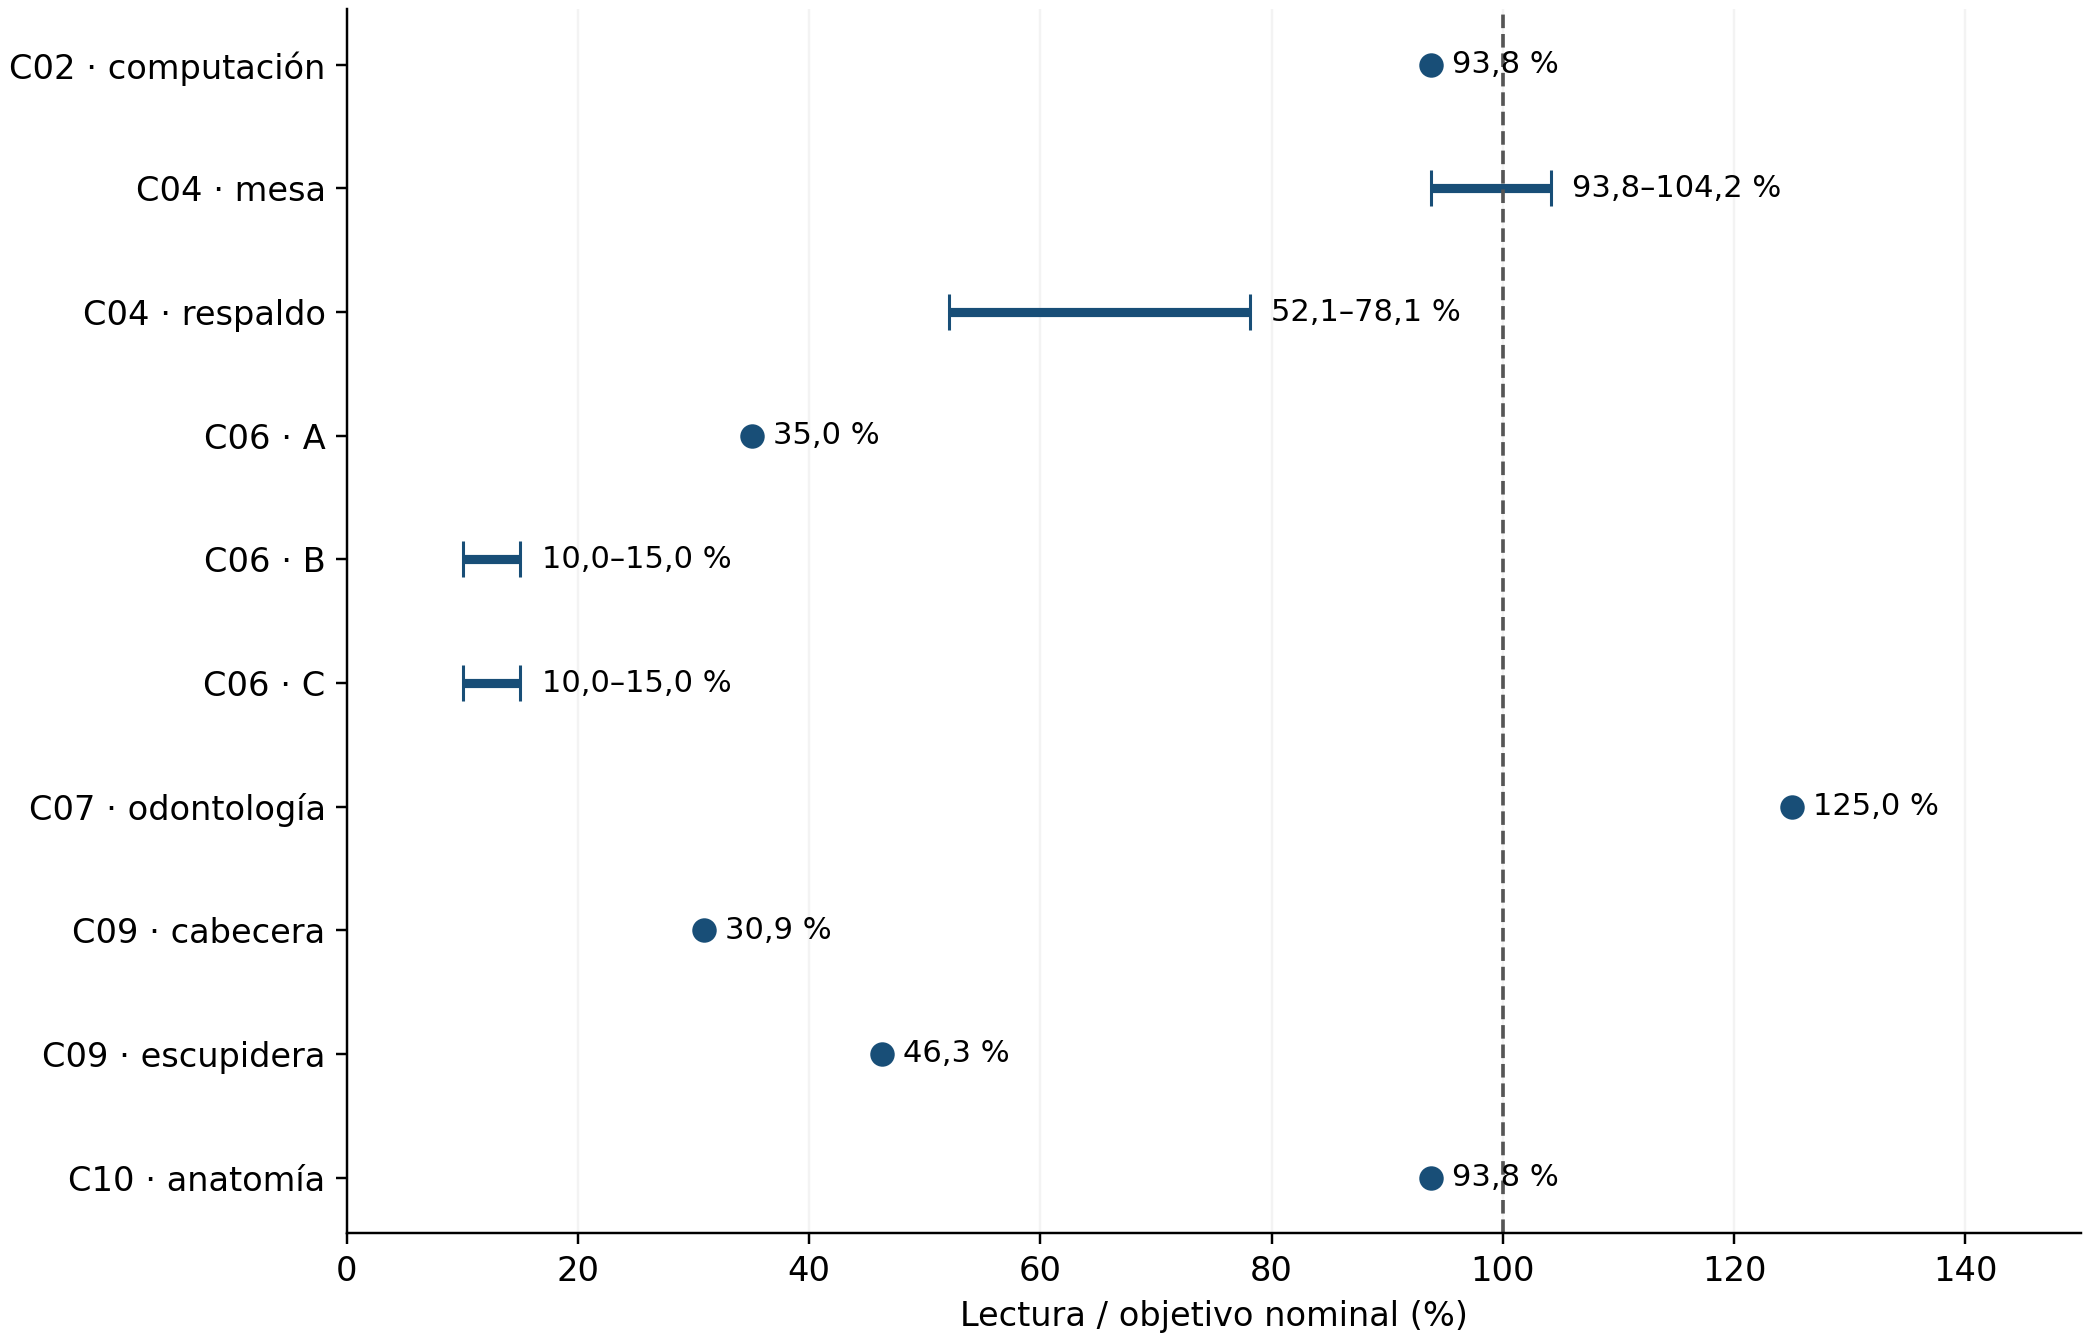
In C04, the reading at 1 m included the target; at 2 m, it fell below it. All three C06 positions fell below 100 mJ/cm². C07 reached 125.0% of the target.
C08 had readings of 150 and 75 mJ/cm² after 37 min. In C09, durations were not unambiguously associated with the cards. C10 recorded 30 mJ/cm² at 3 m over 15 min.
Eight comparisons fell below the target, one included it within its range and one exceeded it. Ratios ranged from 10.0–125.0% (Figure 2).
Calculated exposure and readings in classroom G1
| Surface | Distance (m) | Time (s) | E (mW/cm²) | Hcalc (mJ/cm²) | Hvis/Hcalc (%) |
|---|---|---|---|---|---|
| Table | 1 | 900 | 0.108 | 97.2 | 92.6–102.9 |
| Chair back | 2 | 1800 | 0.054 | 97.2 | 51.4–77.2 |
E: irradiance recorded on poster C04. Hcalc = E × t; Hvis: visual reading. Target: 96 mJ/cm². These irradiances are not automatically identified with the spreadsheet measurements.
Using the irradiances recorded in C04, calculated doses were 97.2 mJ/cm² at both positions, 1.25% above the target. Cards indicated 90–100 and 50–75 mJ/cm²: 92.6–102.9% and 51.4–77.2% of Hcalc (Figure 3). Equivalent mean irradiances were 0.100–0.111 and 0.0278–0.0417 mW/cm². The spreadsheet places 0.054 mW/cm² at 1 m for 60 W and 0.092 mW/cm² at 1 m for 120 W; equal calculated doses in C04 do not imply equal local electronically measured irradiance.
Electronic characterisation of the sources
| Power (W) | Distance (m) | Irradiance (mW/cm²) | Equivalent (µW/cm²) | Time for 32 (min) | Time for 100 (min) |
|---|---|---|---|---|---|
| 10 | 0.2 | 0.11 | 110 | 4.85 | 15.15 |
| 60 | 0.2 | 0.33 | 330 | 1.62 | 5.05 |
| 60 | 1 | 0.054 | 54 | 9.88 | 30.86 |
| 120 | 1 | 0.092 | 92 | 5.80 | 18.12 |
| 60 | 2.5 | 0.021 | 21 | 25.40 | 79.37 |
| 120 | 2.5 | 0.0368 | 36.8 | 14.49 | 45.29 |
Source: Dosis Tesla UV Rays.xlsx, worksheets '20 cm', '1 m' and '2.5 m'. Times were calculated as dose/irradiance and are neither observed durations nor efficacy thresholds. Rows for 222 nm were excluded. Electronic references, including the 10 W value at 20 cm, were not assigned to cards without geometric correspondence.
At 20 cm, the 60 W source irradiance of 0.33 mW/cm² implies 1.62, 5.05 and 12.63 min for 32, 100 and 250 mJ/cm². The 10, 31 and 78 min recorded in that row do not reproduce those targets; recalculated times were used. The spreadsheet contains no recorded irradiances at 2, 3 or 5 m.
Discussion
The central finding is variation in readings across positions and conditions. In G1, doubling time arithmetically compensated for the lower recorded irradiance, but the cards showed different responses. The 97.2 mJ/cm² represents the C04 calculation using irradiances from its poster. The electronic spreadsheet retains references at other distances; the documentary comparison keeps those sources separate from local readings.
Differences between headrest and table in C08, and between headrest and spittoon in C09, are consistent with spatially heterogeneous exposure. This pattern agrees with the variation by sensor location and orientation described by Boyce and colleagues in hospital rooms [1]. Photographs contextualise equipment and furniture arrangement; specific interpretation of geometry and surface is considered under Scope and limitations.
Irradiance × time calculates exposure under constant irradiance. Photochromic readings also depend on indicator response and interpretation; detector spectral and angular response and calibration affect radiometry [4]. C07 and C08 recorded 0.021 mW/cm² at 1 m; the electronic spreadsheet records that value at 2.5 m for 60 W. It corresponds to 12.6 mJ/cm² in 10 min and 46.6 mJ/cm² in 37 min at that reference point. Without geometric association with each card, those calculations do not replace its readings. Eeq expresses visual dose/time, not an independent measurement.
Scope and limitations
The scope is dosimetric and semiquantitative. Visual card readings characterise the response by position and are distinguished from independent radiometric measurements. Comparison with irradiance and time retains that methodological distinction, consistent with work on photochromic indicators and their calibration [2,3]. Local differences from nominal exposures support surface-specific assessment and do not allow an entire room to be represented by a single card.
Convenience selection and diversity of surfaces, distances, times and orientations restrict the results to the conditions assessed and do not allow a causal effect of distance to be isolated. Records retain posters, photographs and the electronic spreadsheet, but not original field sheets or verifiable documentation of historical calibration. Visual uncertainty was not quantified; replication and detector orientation are missing for estimating overall precision. Lighting varied and was not assessed using a paired comparison or illuminance measurements. These features constrain absolute accuracy and extrapolation, while position-specific comparison retains the observations' descriptive scope.
Conclusions
The 14 numerical readings from eight series documented local variation in UVC exposure. Of ten comparisons with nominal targets, eight fell below, one included the target within its range and one exceeded it; ratios ranged from 10.0–125.0%. In G1/C04, a calculated 97.2 mJ/cm² was accompanied by visual readings of 90–100 and 50–75 mJ/cm². The comparison retains the differences in surface, distance and time between those conditions.
Position-specific assessment documented differences between nominal exposure, calculated exposure and card responses. These results support dosimetric characterisation of each surface under its geometry and exposure conditions. Semiquantitative readings describe that local variation; microbiological efficacy and infection prevention require outcomes different from those measured in this study.
Disclosures
Funding. The study was financed through contributions from the participants.
Institutional authorisation. Procedures were conducted as part of an academic research activity authorised by the dean's office of Universidad Católica Redemptoris Mater. The university approved the study and the final manuscript. Environmental exposures were conducted without occupants, and this analysis included no interventions in people or individual clinical data.
Author contributions and approval. All authors participated in data collection and writing of the original works, with equivalent contributions. All confirmed their names, ORCID identifiers and contributions and approved the final manuscript.
Conflicts of interest. The instructor supervising the academic activity, Kevin Virgilio Morales Chamorro, is founder and chief executive officer of MedETechni, a brand appearing on some equipment in the study's photographic archive.
Data availability. The 14 coded visual readings, six electronic profiles, dictionary, reproducible calculations and dosimetric supplement are supplied. Posters, original photographs and the Dosis Tesla UV Rays.xlsx spreadsheet are retained as sources in the study record. Data are provided in the article's supplementary material.
Use of artificial intelligence. Generative artificial intelligence based on a language model, through Codex (OpenAI; GPT-6.1 Sol model), supported document organisation, arithmetic checking and text editing. The authors retain responsibility for the final content. The photographs included are original and were neither generated nor modified using artificial intelligence.
References
4- Boyce JM, Farrel PA, Towle D, Fekieta R, Aniskiewicz M. Impact of Room Location on UV-C Irradiance and UV-C Dosage and Antimicrobial Effect Delivered by a Mobile UV-C Light Device. Infect Control Hosp Epidemiol. 2016;37(6):667–672. doi:10.1017/ice.2016.35.
- Neu DT, Mead KR, McClelland TL, Lindsley WG, Martin SB, Heil G, et al. Surface Dosimetry of Ultraviolet Germicidal Irradiation Using a Colorimetric Technique. Ann Work Expo Health. 2021;65(5):605–611. doi:10.1093/annweh/wxaa147.
- Su A, Grist SM, Geldert A, Gopal A, Herr AE. Quantitative UV-C dose validation with photochromic indicators for informed N95 emergency decontamination. PLoS One. 2021;16(1):e0243554. doi:10.1371/journal.pone.0243554.
- Larason TC, Cromer CL. Sources of error in UV radiation measurements. J Res Natl Inst Stand Technol. 2001;106(4):649–656. doi:10.6028/jres.106.030.
Cite this article
Cristel Francely Miranda Lazo; Lindy Pahola Loza; Jennifer López González; Elba Cristalia González; Axel Alejandro Gámez Guerrero; Pedro Josué Zepeda Espinoza; Alexa Isabella Nicaragua Casaya; Elmer Francisco Baltodano Mejia; Michelle Murillo Sánchez; Bertha Abigail Espinoza Manzanarez; Helen Viviana Cajina Balmaceda; Kristel Dariana Amador Murillo; William Morales Bermúdez; Ilfred Mercedes Reyes Jaime; Emily Isabel Vargas; Keysi Javiera Conto Baltodano; Dubraska Isabel Estrada Márquez; Javier Antonio Chávez Treminio; Jannys Marcela Betancour Urbina; Shirly María Moya Arguello; Gloria Elena Duarte Morales; Ligia Elena Ordóñez Alemán; María José Guadamúz Selva; María Mercedes Rocha Trujillo; Steyssis Guadalupe Berrios Chávez; Alejandra Massiel Dauria Vivas; José Alfonso Castillo Rosales; Franchesca Marie Tercero Sánchez; Fátima Geraldina Chorro Bermúdez; Meyling Ignacia Arley Córdoba; Kevin Alexandro Cazorla Lata; William Conrado; Silvio Alejandro Ortega Chow; Amanda Leticia Vega Fong. Semiquantitative photochromic dosimetry of UV-C exposure in classrooms, dental clinics and restrooms: an exploratory experimental study. MedETechni Journal of Translational Research. 2026;1:e0005-en. https://medetechni.com/journal/articles/e0005/en
RIS for Zotero, Mendeley and EndNote. Exports cite this English translation; the Spanish DOI is retained only by the original.Publication files and materials
Keep the complete article, its figures and metadata for reading and citation.
The package includes ES/EN full texts, both PDFs, figures, metadata, references and a SHA-256 manifest. This is a publication archive; primary research data and research supplements follow the article’s data-availability statement.Enquire about this study’s data or supplementsHistory and versions
- Reported acceptance
- Spanish original published
- Title updated
- HTML full text and English translation
- English PDF and publication archive
The 8 October acceptance was reported and confirmed by the journal owner. Assessment reports, correspondence and decision attribution are retained in the confidential editorial record. The public history shows documented dates; an undocumented submission date is not reconstructed.
Read the original Spanish PDF
The original published PDF, pagination and layout are preserved. The English translation is available as a separate download.