
Changes in surface ATP following 222-nm far-UVC irradiation: a multicentre before-and-after study in 29 healthcare facilities in Chile
Cambios en el ATP superficial tras irradiación far-UVC a 222 nm: estudio multicéntrico antes-después en 29 centros sanitarios de Chile
MedETechni, Santiago, Chile
Original published · English translation
English translation of the Spanish original, prepared by the journal with AI assistance and checked for text, numbers, tables and references. Disclosures and manuscript-approval statements translated below concern the original study. Figures retain their original labels; captions and tables are translated.
Abstract
Objective. To estimate surface ATP change after environmental use of 222-nm far-UVC in Chile.
Methods. Uncontrolled multicentre before-and-after study: 31 facilities considered, 29 treated, and 437 paired surface readings. A 30-minute exposure was applied at an operating distance of 2.5 m, followed by a 10-minute wait before post-cycle measurement. ATP was measured with a 3M Clean-Trace LM1. Facility-level log ratios were combined using REML, with cluster bootstrap and sensitivity analyses.
Results. Median ATP decreased from 199 to 50 RLU. The combined reduction was 81.3% (95% CI 77.7–84.3%), with I²=84.3%. All 437 post-cycle readings were below baseline. Of 174 surfaces initially ≥250 RLU, 173 reached <250 (99.4%) and 145 reached <100 (83.3%).
Conclusions. The cohort documented an ATP decrease in all analyzed surfaces, with variation between facilities. Its contribution is a multicentre estimate of change in organic or biological residues after the intervention. The before-and-after design describes this temporal association without isolating the contribution of UVC or evaluating infection reduction.
Key points
Question. What change in surface ATP was observed after environmental application of 222-nm far-UVC in healthcare facilities in Chile?
Findings. The analysis included 437 surface pairs from 29 facilities. The pooled REML reduction was 81.3% (95% CI 77.7–84.3%). Of the 174 surfaces initially ≥250 RLU, 173 reached <250 RLU and 145 reached <100 RLU.
Meaning. Paired measurement and facility-level analysis quantify the observed environmental ATP change in the cohort and its variation across facilities.
Plain-language summary
Surface ATP signals were measured before and after an intervention using 222-nanometre light in 29 healthcare facilities in Chile. All 437 locations included in the analysis had lower values after the intervention. ATP measures organic or biological residues; it is neither a sterility test nor a direct pathogen count. There was no concurrent control group, so the effect of radiation cannot be separated from other changes between measurements.
Introduction
Quantitative assessment of surfaces can document changes in environmental hygiene in procedure rooms. ATP bioluminescence provides an immediate reading of biological or organic residues. Its interpretation depends on the instrument, surface and sampling procedure; relative light units therefore constitute a distinct outcome and do not directly equate to microorganism counts [1].
Application of 222-nm far-UVC radiation has been studied on surfaces and in air chambers, using different designs and outcomes [2,3]. Evidence obtained with one device in one setting does not, by itself, determine the performance of another configuration. Field evaluation requires assessment of the magnitude of change, its variation across facilities and the documentation of application conditions.
The objective was to estimate the paired change in surface ATP in the Chilean dataset from the environmental evaluation of Virgilio Rays. The analysis focused on the surfaces in the UVC assessment form and kept the source project's supplies, dressings, sanitary supervision and home-care modules separate.
Methods
Design and setting
A multicentre before–after analysis was conducted without randomisation or a concurrent control. The surface location was the unit of observation, and the facility was the clustering unit. Initial planning envisaged 30 facilities. Ultimately, 31 were considered: 29 received Virgilio Rays, and two did not receive the intervention because of access and time constraints. These two facilities are not included in the paired-measurement database and do not constitute an evaluated control group. The 29 treated facilities were coded C01–C29 and included primary care facilities and hospitals. Selection was operational rather than probabilistic. The data consolidation cut-off was 22 September 2026. Signature dates and sampling dates were retained as separate fields. Elements of TREND were used to describe the non-randomised evaluation, and TIDieR was used to structure the intervention description, without claiming full compliance [4,5].
Analytical population
The assessment form contains up to 16 locations per facility: four walls, two curtain sides, the trolley surface and handle, three dispensers, three examination-couch areas, a mouse and the space bar. The main dataset retained 437 complete pairs [6]. Two locations in C19 had baseline readings without follow-up readings and were excluded without imputation. Two complete pairs from C02 were described as outside the equipment's reach, and an ammonium-container lid in C11 was recorded as an extra sample; these were retained in a supplementary dataset for an inclusion sensitivity analysis. Of the 464 theoretical form positions, 23 had no measurement at either time point. Physical absence and an empty field were distinguished when the source allowed.
Intervention and sampling
Virgilio Rays, a mobile system with a filtered KrCl source nominally emitting at 222 nm, was used. At all 29 treated facilities, baseline ATP was measured immediately before UV application began. Emission lasted 30 minutes at an operating distance of 2.5 m, followed by a 10-minute wait before the second and final measurement. The T40 label denotes a reading after the cycle and waiting period; the records do not provide individual timestamps.
ATP measurement
The Instituto Nacional de Heridas (INH) performed sampling and initial tabulation and supplied the database to MedETechni for analysis. INH ratified the data and their identification by facility, surface and recorded incident. ATP was recorded using a 3M Clean-Trace LM1 luminometer. The protocol describes a 5 cm² template and sampling the same location before and after; the actual swabbed area, calibration, swab batches and technical replicates are not consistently documented. URL/RLU labels were normalised to ATP-RLU. The original colours were audited separately from the derived numerical classification.
Individual readings were stratified using published reference bands for Clean-Trace: <100 RLU, 100–249 RLU and ≥250 RLU [7–10]. The first two retain the literature labels 'very clean' and 'clean' solely for analytical description; ≥250 indicates that the study benchmark was exceeded. These are adapted bands and do not reproduce Pontes's duplicate-swab algorithm for surgical instruments [7]. The ≥250 convention explicitly assigns the exact boundary value. The benchmark is neither a universal standard nor a manufacturer's regulatory requirement. ATP reflects detectable organic or biological residues and does not directly equate to CFU, absence of pathogens, sterility or reductions in healthcare-associated infections [1,7–10].
For each pair, ΔRLU=PRE−POST and percentage reduction=100×(PRE−POST)/PRE were calculated. If PRE=0, the percentage is reported as not calculable, and absolute change is analysed. Continuous values are the primary quantitative outcome; categories are complementary. The current cohort contains no PRE or POST zeros. Logarithmic analyses require both values to be positive; no pseudocounts are added.
Dosimetry and implementation
Historical radiometry records 0.015 mW/cm² at 2.5 m, equivalent to a reference radiant exposure of 27 mJ/cm² over 30 minutes. The nominal distance matches the study's operating distance. No surface-specific radiometric measurements were taken during sampling, so this reference was not assigned as the actual dose received. The 10-minute interval refers to the second ATP measurement and is not interpreted as validation of safe re-occupancy.
Statistical analysis
The post-intervention/baseline ratio and its natural logarithm were calculated for each pair. Within each facility, the mean log ratio and its sample variance divided by the number of pairs were estimated. The primary estimator was a random-effects synthesis with between-facility variance estimated by restricted maximum likelihood (REML). The transformation 1-exp(μ) expresses the pooled reduction. A normal 95% CI, Hartung–Knapp sensitivity analysis, I², τ² and a t-distribution prediction interval were reported. The analytical plan was documented after the data became available and is not presented as preregistration. The local variance of the mean assumes residual independence of sampling within a facility; the clustered bootstrap and alternative models assess robustness without establishing that assumption.
Robustness and inference
A statistician reviewed and ratified matching, facility-level clustering and analysis. A random-intercept model, exchangeable Gaussian GEE and OLS with facility-robust errors were applied. The bootstrap resampled 29 whole facilities with replacement over 50,000 replicates, using seed 2222026. Leave-one-facility-out analyses, extreme baseline burden, source incidents and the three supplementary pairs were assessed. Comparisons by surface type and adjusted models were exploratory. Families of adjusted coefficients were corrected using Benjamini–Hochberg. Individual paired tests are supplied as secondary results that do not model within-facility dependence; the facility-level sign test retains clustering.
Ethics and confidentiality
The source project has an approval letter from the Scientific Ethics Committee of the Fundación Instituto Nacional de Heridas (CEC–FINH), dated 4 May 2026, for the protocol 'Monitoreo de Condiciones Sanitarias y Manejo de Insumos Clínicos en la Curación de heridas en Salas de procedimientos y Atención Domiciliaria'. Approval covered the procedures from the outset, and the committee was informed of their implementation. This analysis uses environmental measurements without individual patient data. Facilities are coded C01–C29; the name-to-code correspondence and identifiable documents remain in internal custody.
Results
The analysis included 437 paired surface measurements from 29 facilities. Values were checked against the original tables and retained unique facility and surface identifiers.
| Indicator | Result |
|---|---|
| Facilities | 29 |
| Pairs | 437 |
| Baseline ATP, median (IQR) | 199 (133-422) RLU |
| Post-intervention ATP, median (IQR) | 50 (28-82) RLU |
| Baseline and post-intervention sums | 195,637 / 24,567 RLU |
| Aggregate reduction | 87.4% |
| Individual geometric reduction | 81.4% |
| Facility-level REML synthesis | 81.3% (77.7%-84.3%) |
| Pairs showing a decrease | 437/437 |
| Post-intervention <100 RLU | 406/437 (92.9%) |
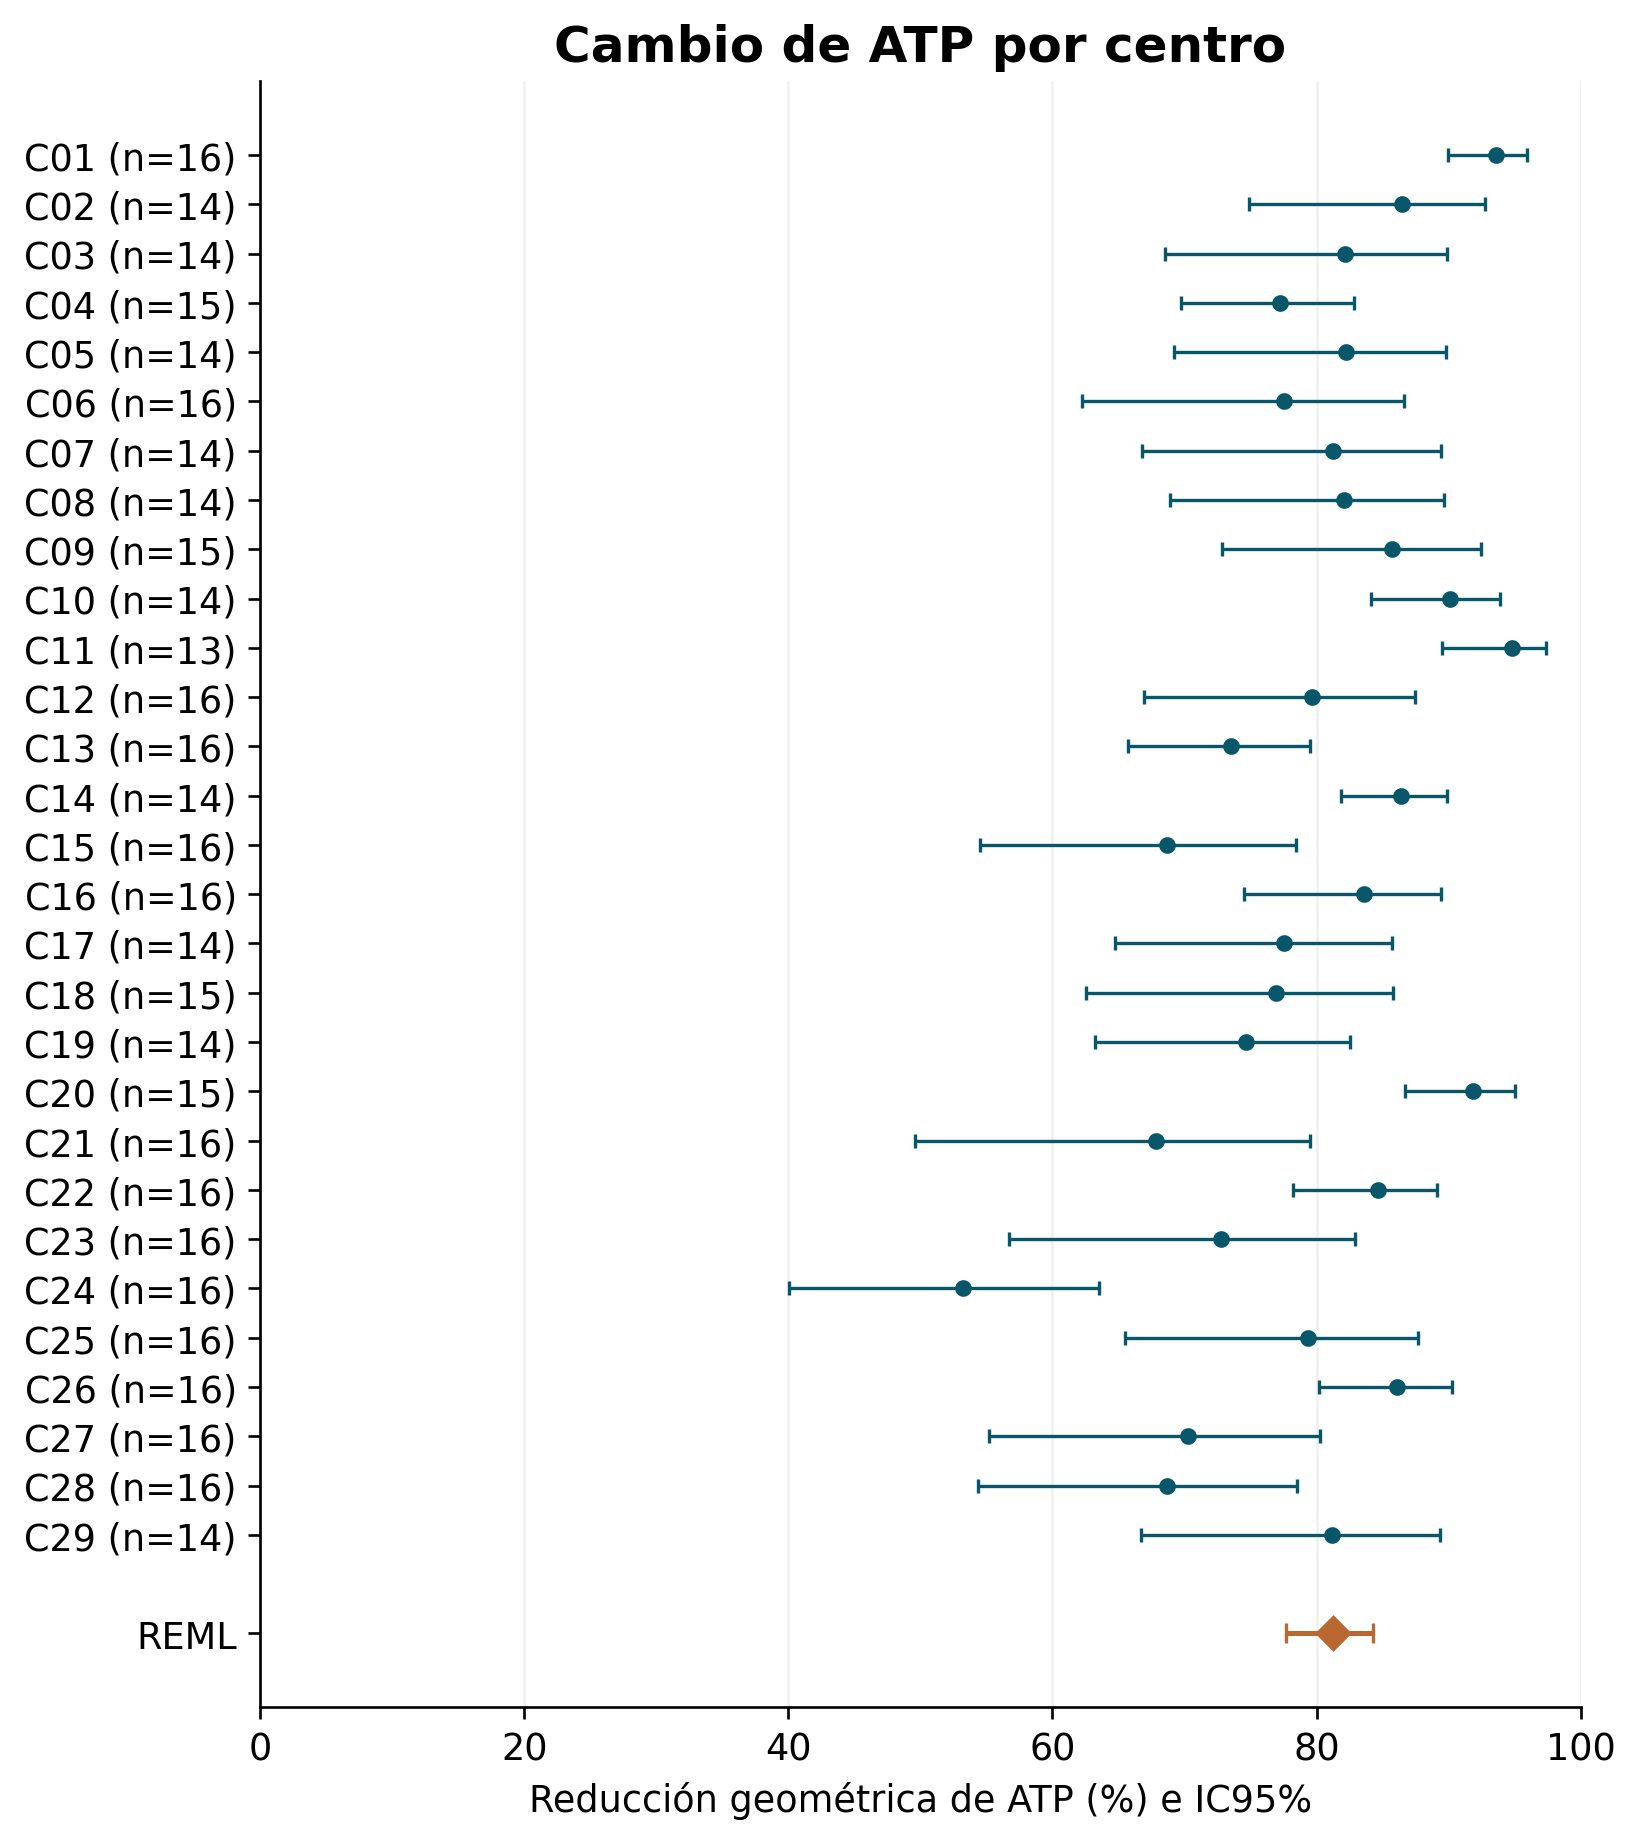
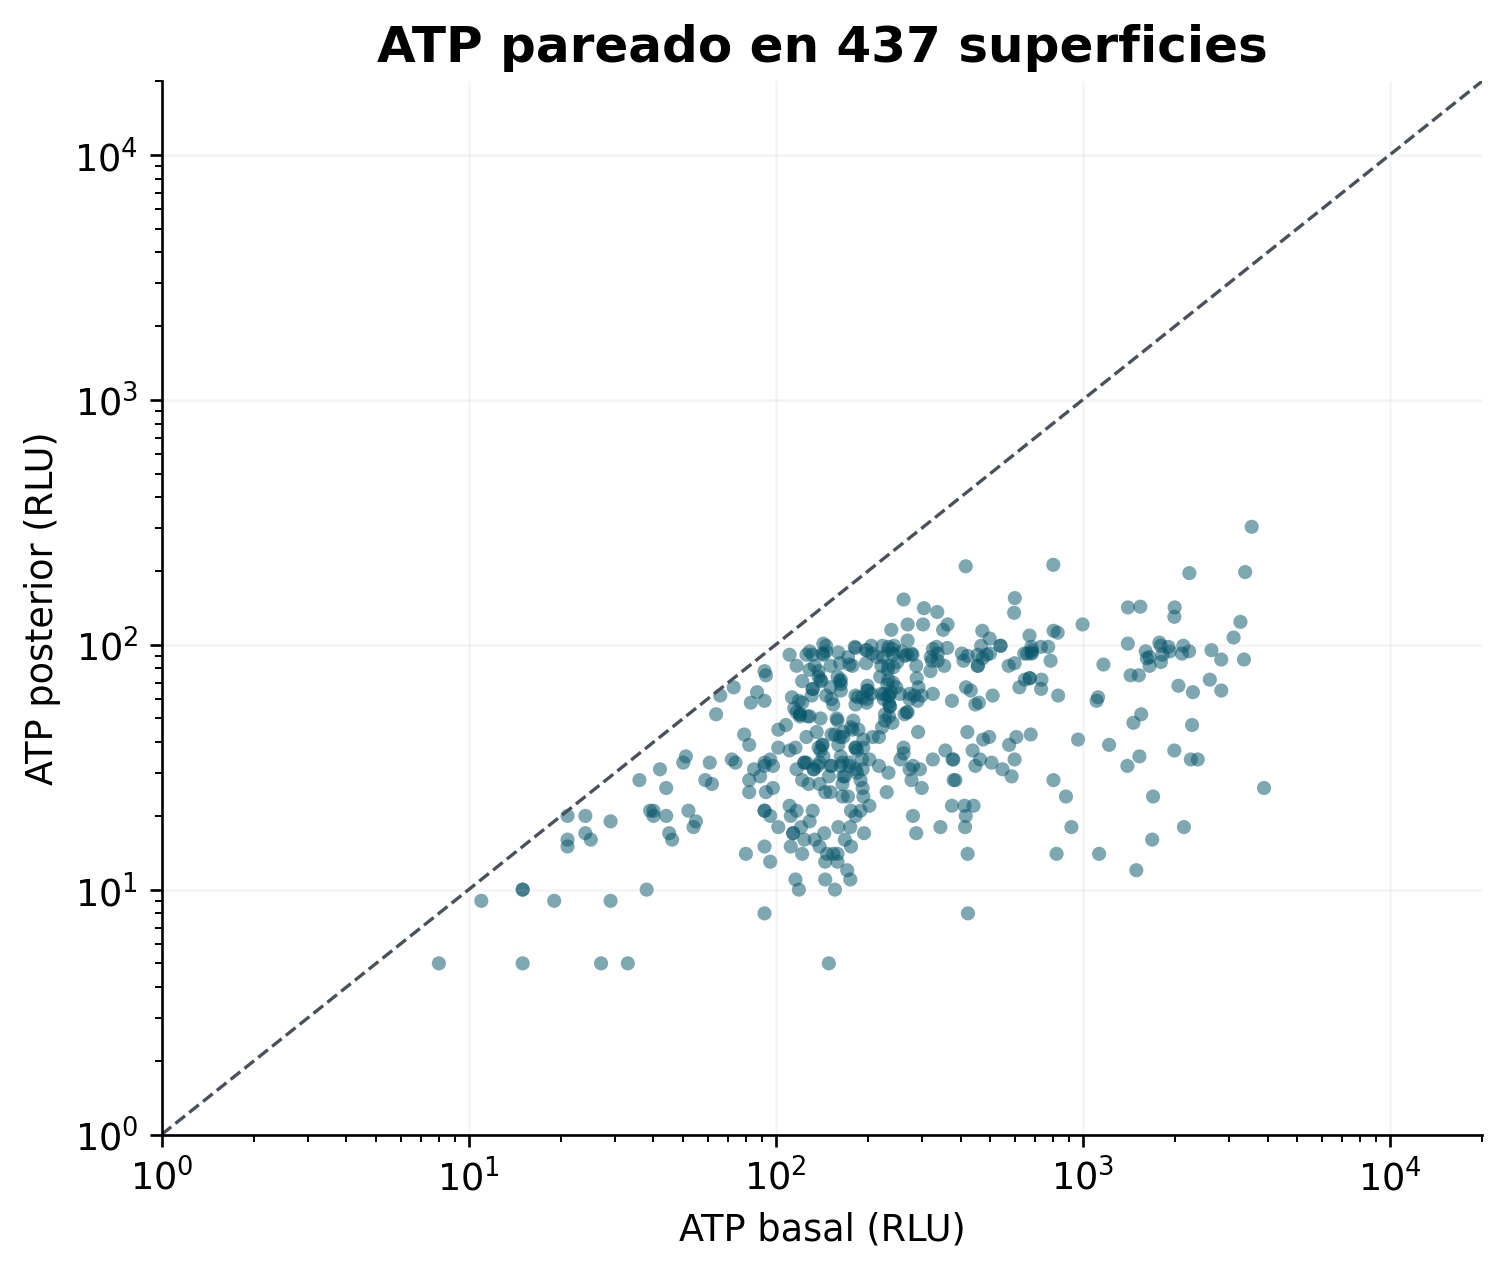
The REML reduction was 81.3% (95% CI 77.7%-84.3%). Heterogeneity was I²=84.3% and τ²=0.189; the prediction interval was 53.5%-92.5%. Hartung–Knapp produced a 95% CI of 77.5%-84.4%. The two-sided facility-level sign test yielded p=3.73×10⁻⁹. Facility effects and the original pairs are shown in Figures 1 and 2.
The mixed model estimated an 81.6% reduction (95% CI 78.0%-84.6%). For the individual geometric reduction of 81.4%, the facility-level bootstrap produced a 95% CI of 78.0%-84.4%. The aggregate reduction of 87.4% had a bootstrap 95% CI of 84.8%-89.6%. These estimators apply different weights and are not interchangeable.
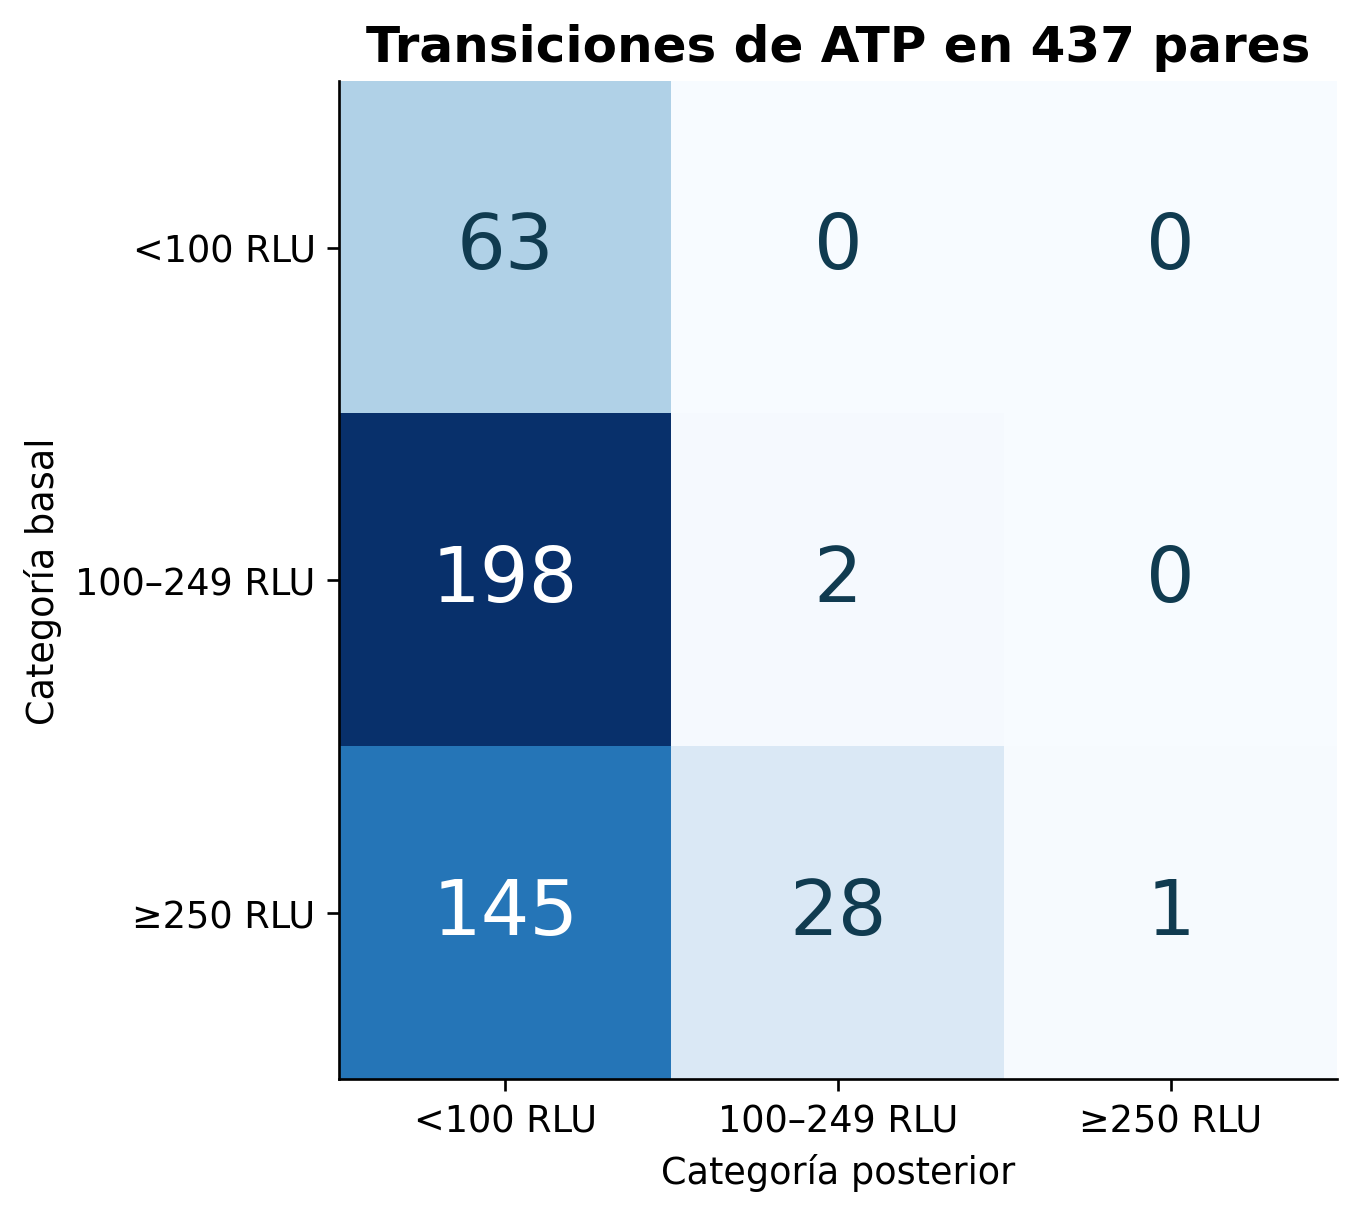
The median individual reduction was 78.5%, the arithmetic mean was 73.6% and the median absolute decrease was 151 RLU. Post-intervention values were <100 RLU at 406/437 locations (92.9%). The paired operational-classification matrix is developed below. Figure 3 retains the complete transition matrix.
PRE: mean 447.7 RLU (SD 634.2); POST: mean 56.2 RLU (SD 37.0). ΔRLU: mean 391.5 (SD 620.6), median 151 (IQR 86–373). Individual percentage reduction: mean 73.6% (SD 19.9), median 78.5% (IQR 63.0–89.1).
| Surface | n | Geometric reduction | Facility-level bootstrap 95% CI |
|---|---|---|---|
| Examination couches | 87 | 77.9% | 72.2%-83.0% |
| Trolleys, tables and handles | 58 | 81.4% | 77.0%-85.1% |
| Curtains | 40 | 84.1% | 78.0%-88.8% |
| Dispensers | 82 | 77.6% | 73.3%-81.4% |
| Walls | 116 | 75.7% | 68.2%-82.1% |
| Administrative area | 54 | 93.3% | 90.8%-95.1% |
Facility C29 showed a decrease at all 14 locations and an aggregate reduction of 88.3% (11,818 to 1,378 RLU). Nine of its 14 post-intervention values were <100 RLU. The highest residual reading was 303 RLU on the space bar. The form recorded no curtain on the first side and left the second side blank; readings were not imputed.
When facilities were omitted one at a time, individual geometric reduction ranged from 80.6% to 82.0%. The earlier analysis without C29 retained 423 pairs and a geometric reduction of 81.4%. Including the three supplementary pairs increased the total to 440, with a geometric reduction of 81.6% and an aggregate reduction of 88.2%. C07 and C17 were analysed as separate facilities. Excluding C07, C17 or both produced a REML reduction of 81.3–81.4%; excluding both produced a 95% CI of 77.6–84.6%. Sensitivity analyses retained the direction and approximate magnitude of the result.
Change in cleanliness category
| PRE / POST | <100 RLU | 100–249 RLU | ≥250 RLU | PRE total |
|---|---|---|---|---|
| <100 RLU | 63 | 0 | 0 | 63 |
| 100–249 RLU | 198 | 2 | 0 | 200 |
| ≥250 RLU | 145 | 28 | 1 | 174 |
| POST total | 406 | 30 | 1 | 437 |
Of the 174 surfaces with PRE ATP-RLU ≥250, 145 reached <100 (83.3%), 28 reached 100–249 (16.1%) and one remained ≥250 (0.6%). Combined conversion to <250 was 173/174 (99.4%). Of the 200 initially clean surfaces, 198 moved to very clean and two remained clean. All 63 initially very clean surfaces remained in that category. Category improved in 371/437 (84.9%), remained unchanged in 66/437 (15.1%) and worsened in 0/437 (0%). Values <100 increased from 63/437 (14.4%) to 406/437 (92.9%); values of 100–249 changed from 200/437 (45.8%) to 30/437 (6.9%); values ≥250 decreased from 174/437 (39.8%) to 1/437 (0.2%).
The facility-bootstrap 95% CI was 98.1–100% for conversion to <250 and 74.2–91.5% for conversion to <100 (50,000 replicates). These are resampling intervals for the observed cohort; an endpoint of 100% does not establish population-level certainty. All 29 facilities increased their proportion <250 (two-sided facility-level sign test p=3.73×10⁻⁹). The facility appendix includes descriptive statistics, all nine transitions, descriptive Wilson CIs and exploratory paired tests.
Discussion
The Chilean dataset showed a surface ATP reduction that was consistent in direction and variable in magnitude. Facility-level analysis and sensitivity analyses retained a similar result, indicating that the estimate does not depend on a single facility or the addition of the final facility. The synthesis quantifies a temporal association observed during the environmental intervention.
The aggregate reduction of 87.4% exceeds the arithmetic mean of 73.6% because it gives greater influence to surfaces with high baseline signals. The REML synthesis and geometric reduction are around 81%. Reporting these metrics separately avoids presenting the percentage change in the RLU sum as though it were the typical change for each surface.
ATP bands organise the environmental outcome using a literature benchmark adapted to individual readings. The 250-RLU threshold is interpreted according to this study's procedure, rather than as a universal standard or regulatory requirement. ATP characterises detectable organic or biological residues; viable microorganism counts and healthcare-associated infections are distinct outcomes that were not measured here. [1,7–10]
Scope and limitations
The multicentre before–after design describes the temporal change in ATP on the measured surfaces. The absence of a concurrent control and repeated baseline measurements prevents separation of the effect of radiation from intervening cleaning, the first swab, natural variation and regression to the mean. Exact coincidence or adjacency of sampled areas was not consistently documented, and there were no sampling controls or persistence measurements. Baseline burden forms part of the percentage-reduction denominator, so its association with response also has a mathematical component.
Operational selection and heterogeneity restrict the results to the observed cohort. The applied cycle was 30 minutes at 2.5 m, followed by a 10-minute wait; individual records of time, radiometry, calibration and effective sampling area had uneven documentation. The technical log of 26 visits provides context and is not fully linked to C01–C29.
Conclusions
Across the 437 analysed surfaces from 29 healthcare facilities, post-intervention ATP was lower than baseline. The median decreased from 199 to 50 RLU, and the facility-level REML synthesis estimated an 81.3% reduction (95% CI 77.7–84.3%), with substantial heterogeneity (I²=84.3%). Of the 174 surfaces initially ≥250 RLU, 173 fell below 250 and 145 below 100; these thresholds constitute the analytical benchmark defined for the study.
The study provides a reproducible multicentre estimate of an ATP decrease observed in every pair, with magnitude varying across facilities. Agreement in direction and sensitivity analyses describe the consistency of the environmental outcome in this cohort. The estimate concerns change following the intervention and retains the associative scope of the design; it does not quantify an effect attributable exclusively to UVC or a reduction in viable microorganisms or infections.
Data availability and disclosures
The coded v9.4 dataset, its dictionary, statistical tables, figures and reproducible code are included as supplementary material. Facilities remain coded; the name-to-code correspondence and identifiable originals remain in internal custody.
Funding, contributions and transparency
MedETechni provided resources, the device, logistics, analysis and preparation work for this study. Support from Chile's Agencia Nacional de Investigación y Desarrollo (ANID), Startup Ciencia 2025 competition, project SUC250032, is acknowledged. The Instituto Nacional de Heridas (INH) performed sampling and initial tabulation and supplied the data to MedETechni for analysis. The project award is documented in ANID Exempt Resolution No. 3325/2025.
The authors are affiliated with MedETechni, developer of Virgilio Rays and publisher of MedETechni Journal of Translational Research. This commercial and editorial relationship is disclosed. The analysis was performed with sponsor participation. INH ratified the database, and a statistician reviewed matching, facility-level clustering and analysis.
Kevin Virgilio Morales Chamorro and Gricell Jeraldina Báez Arévalo: analysis, interpretation and writing. Anabell Chamorro is acknowledged for project logistics and administration.
Generative artificial intelligence based on a language model, through Codex (OpenAI; GPT-6.1 Sol model), was used to prepare analysis code, review consistency, draft and lay out documents and figures. The code and sources enable checking; final scientific review and responsibility rest with the authors.
References
10- Sanna T, Dallolio L, Raggi A, Mazzetti M, Lorusso G, Zanni A, et al. ATP bioluminescence assay for evaluating cleaning practices in operating theatres: applicability and limitations. BMC Infect Dis. 2018;18(1):583. doi:10.1186/s12879-018-3505-y.
- Leow CH, Saw LH, Low FS, King YJ. Investigations on the surface disinfection efficacy of far-UVC 222 nm germicidal irradiance device in a controlled environment and field test. J Environ Health Sci Eng. 2024;22(2):569–577. doi:10.1007/s40201-024-00918-w.
- Eadie E, Hiwar W, Fletcher L, Tidswell E, O’Mahoney P, Buonanno M, et al. Far-UVC (222 nm) efficiently inactivates an airborne pathogen in a room-sized chamber. Sci Rep. 2022;12(1):4373. doi:10.1038/s41598-022-08462-z.
- Des Jarlais DC, Lyles C, Crepaz N; TREND Group. Improving the Reporting Quality of Nonrandomized Evaluations of Behavioral and Public Health Interventions: The TREND Statement. Am J Public Health. 2004;94(3):361–366. doi:10.2105/AJPH.94.3.361.
- Hoffmann TC, Glasziou PP, Boutron I, Milne R, Perera R, Moher D, et al. Better reporting of interventions: template for intervention description and replication (TIDieR) checklist and guide. BMJ. 2014;348:g1687. doi:10.1136/bmj.g1687.
- MedETechni. Expediente ambiental UVC 222 nm: base de 29 centros y 437 pares [conjunto de datos y código de análisis]. Versión 9.4. Santiago: MedETechni; 2026. Corte documental: 22 de septiembre de 2026. Datos primarios codificados y código de análisis adjuntos al artículo.
- Pontes DO, Costa DM, da Silva Pereira PP, Whiteley GS, Glasbey T, Tipple AFV. Adenosine triphosphate (ATP) sampling algorithm for monitoring the cleanliness of surgical instruments. PLoS One. 2023;18(8):e0284967. doi:10.1371/journal.pone.0284967.
- Amin SR, Folkert CM, Erie JC. Assessing the Effectiveness of Surface Cleaning Methods in Intravitreal Injection Procedure Rooms. Ophthalmology. 2014;121(1):276–282. doi:10.1016/j.ophtha.2013.08.006.
- Moore G, Smyth D, Singleton J, Wilson P. The use of adenosine triphosphate bioluminescence to assess the efficacy of a modified cleaning program implemented within an intensive care setting. Am J Infect Control. 2010;38(8):617–622. doi:10.1016/j.ajic.2010.02.011.
- Nante N, Ceriale E, Messina G, Lenzi D, Manzi P. Effectiveness of ATP bioluminescence to assess hospital cleaning: a review. J Prev Med Hyg. 2017;58(2):E177–E183. PMID:28900359.
Cite this article
Kevin Virgilio Morales Chamorro; Gricell Jeraldina Báez Arévalo. Changes in surface ATP following 222-nm far-UVC irradiation: a multicentre before-and-after study in 29 healthcare facilities in Chile. MedETechni Journal of Translational Research. 2026;1:e0004-en. https://medetechni.com/journal/articles/e0004/en
RIS for Zotero, Mendeley and EndNote. Exports cite this English translation; the Spanish DOI is retained only by the original.Publication files and materials
Keep the complete article, its figures and metadata for reading and citation.
The package includes ES/EN full texts, both PDFs, figures, metadata, references and a SHA-256 manifest. This is a publication archive; primary research data and research supplements follow the article’s data-availability statement.Enquire about this study’s data or supplementsHistory and versions
- Reported acceptance
- Spanish original published
- Title updated
- HTML full text and English translation
- English PDF and publication archive
The 8 October acceptance was reported and confirmed by the journal owner. Assessment reports, correspondence and decision attribution are retained in the confidential editorial record. The public history shows documented dates; an undocumented submission date is not reconstructed.
Read the original Spanish PDF
The original published PDF, pagination and layout are preserved. The English translation is available as a separate download.